
2020 Election Impact and an Update on the U.S. Economy
Recorded Wednesday, December 4th, 2 – 2:30 PM
Senior Investment Advisor Laurent Harrison, CFP® and Portfolio Manager Ryan Kelley, CFA presented our 2019 4th Quarter Investment Committee webinar. This webinar covers:
- 2020 election possibilities and potential impacts on the market
- An update on the recession signals discussed in Bell’s Q3 webinar
- A review of the U.S. economy
2020 Election Impact and an Update on the US Economy
This transcript has been edited for clarity and ease-of-reading.
Laurent Harrison, CFP®: Welcome to our final webinar of 2019 and thank you for joining us today. My name is Laurent Harrison, Senior Investment Advisor and Financial Planner, and I have beside me today Ryan Kelley, Chartered Financial Analyst, one of our portfolio managers. Today we will be spending our time reviewing what’s happened in the financial markets in 2019, and take a look at what may happen in 2020 with the elections coming up in 11 months or so from today. We’ll also give you some valuable year-end tax planning tips that you’ll still have time to do and take advantage of before 2019 comes to a close. So, I’ve just covered what we’re going to cover today these four areas. So, Ryan though is going to cover the first two of these. Ryan?
Ryan Kelley, CFA®: Great, thanks Laurent. So, I thought we’d start off by – I know there’s not a whole lot left in the year – so, this is sort of 2019 wrap up a little bit early. You can see with the numbers up here (Figure 1) that, year-to-date, most broad categories of asset classes are investments have delivered great returns. There’s a similar theme that we’ve been seeing over the past several years where the dominant category is U.S. large company stocks. As you can see as of the period of this chart, of almost 30% or so, which is certainly a great result. But you’ll notice pretty much everything else is also positive and even the U.S. bond market almost hit double-digit returns. There was a slight pullback in recent times, but clearly this has been a great year for investors.
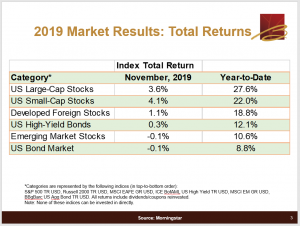
Chart of Index Total Return by category, for November 2019 / Year-to-Date: US Large-Cap Stocks 3.6% / 27.6%, US Small-Cap Stocks 4.1% / 22%, Developed Foreign Stocks 1.1% / 18.8%, US High Yield Bonds 0.3% / 12.1%, Emerging Market Stocks -0.1% / 10.6%, US Bond Market -0.1% / 8.8%
Figure 1 – 2019 Market Results: Total Returns
I want to point out that while U.S. large cap stocks have been kind of near hitting and still pretty close to all-time highs, that’s not necessarily the case with other types of stocks. So, if you look at even U.S. small cap stocks or international stocks, they’re actually still below their peaks that they reached last year. So, really the U.S. is kind of the stand out performer, particularly in the large cap space.
You can see this illustrated in this following chart (Figure 2) as well just the disparity between S&P 500, representing the 500 largest publicly traded stocks in the U.S., and global stocks. And you can see the pretty big – while both positive – you can see the pretty big disparity there. So, the other thing you can see is also just of course what’s been in the news lately is the trade war, the different marks here show different events, and how it’s driven the market. And in fact, just this week there’s been even more news which has led to some market volatility. Specifically, if you look at the final vertical bar here where it says “Deal progress” about mid-October, that was the news that what was dubbed the phase one mini deal between the U.S. and China. It wasn’t supposed to resolve the entire trade dispute, but it was sort of a first step. It was announced they would sign it in October and that would lead to a market rally. Well, just on Monday you’ve had some negative news: that still hasn’t been signed, and the White House has come out saying, “Well, we think a final deal might not even get signed until after the presidential election.”
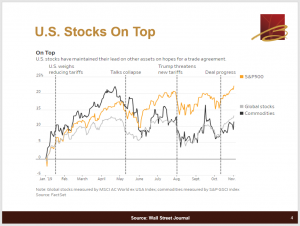
Figure 2 – US Stocks on Top
You have China kind of making some noise about, I think they called it “An unreliable entities list” they wanted to publish, which would largely be some retaliation against American corporations. As well as the deal was supposed to halt further tariff increases. And since this phase one mini deal did not get signed, there was already a pre-scheduled December 15th increase – it was going to be a 15% tariff increase on $160 Billion of imports from China to the U.S. So, obviously without the mini deal being signed, this increase is still scheduled to go into effect. So, I’m sure that will drive near-term volatility as well.
And it’s actually not just China.
Other events this week related to trade: there’s been new or proposed tariffs targeting Brazil and Argentina. In that case, it’s mostly raw metal imports or exports from those countries to the U.S. As well as a separate issue: a dispute with France relative to a digital services tax they want to implement. And so the U.S. has proposed potentially adding some pretty big tariffs on cheese, champagne, I think luxury handbags and a few other things. So, there’s kind of new fronts opening up on the trade dispute as well. So, it’s pretty clear that this trade is going to be front-and-center and continue to drive the markets into the New Year as well.
What we can see also related to these trade wars I was discussing is that there’s actually been somewhat of an effect on U.S. companies relative to where they get their revenue from. So, what this chart shows (Figure 3) on the left on the light blue bar is that earnings for large companies (large U.S. companies in the S&P 500) if most of their revenue is coming from U.S. sources, their earnings have been about flat. Maybe we’d want them to be growing, but at least they’re roughly flat. But if you look on the green bar on the right, you can see that U.S. corporations that get a large percentage, over 50%, of their revenue from foreign sources have actually seen their earnings drop by about 7.5%. So, you can see a bit of disparity which 1) highlights the U.S. economic strength, but 2) potentially incorporates some of the trade war effect that’s happening in the global economy.
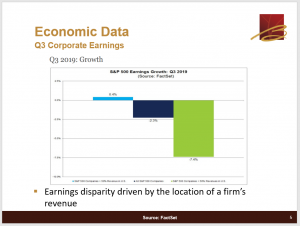
Figure 3 – Economic Data: Q3 Corporate Earnings
Another thing that happened (this actually happened back in October) but you can see interest rates and the Federal Reserve. So this sort of dark green line that looks sort of like a staircase going down (Figure 4), this is the Federal Reserve cutting their short-term interest rates. You can see the final one (where I put an arrow to) where they did make a cut. But then they kind of came out and said we’re probably not going to be doing any more cuts for the rest of the year, nor even into 2020 because economic data seems to be pretty decent and we don’t think the data warrants further interest rate cuts. You can see with the red line (which shows the interest rate that the government is paying on 10-year Treasury bonds) immediately went up with this news although did retrace back to about where it was when they made the announcement. So, this did effect the bond market. And I kind of mentioned in the beginning how the bond market almost hit double digit returns and this kind of pullback you can see is part of it. Which led to it maybe increasing about 8.5% year-to-date.
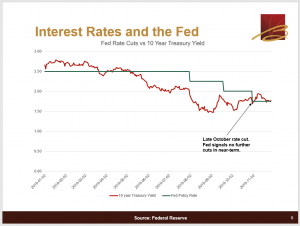
Figure 4 – Interest Rates and the Fed
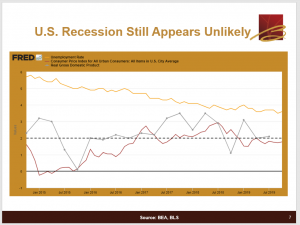
Related to what the Fed said, not only did they first come out and say we don’t feel more cuts are warranted, but about mid-November Fed Chair Jerome Powell came out and said, “not only that, we think the economic expansion will continue.” Markets certainly like this, which led to some stock market gains. And here’s just some pretty basic broad data points (Figure 5). So, the orangish-yellow line that’s trending down is unemployment and you can see it’s still on a downward trend. I mean, it’s flattened out a bit, but it is sitting at historic lows. So, certainly that’s a great situation there. If you look at the red line that is inflation, so the Fed’s dual mandate is to target both economic strength and inflation. And you can see it’s slightly below target. So, certainly a benign condition and is probably one of the reasons that they decided that they don’t need to keep cutting rates. But also don’t really need some of their justification for previous raises as well. The inflation just really isn’t a factor, (not too low, not too high). It’s kind of close to target. So, that’s certainly not a bad outcome. And then the more jagged bluish or gray line is actually GDP growth. That is a core lead static so we’re missing a bit of data. But the last third quarter number is on there. It was just over 2%. So, while 2% GDP growth isn’t spectacular, it is still positive and means the economy is still growing. Certainly not a bad result either. So, all in all just showing that the data still looks good, the Fed has come out and confirmed that. So, that’s pretty much one of the main reasons the stock market is close to all-time highs.
Laurent Harrison, CFP®: So, Ryan, I know I’ve been seeing some headline news in the last few months. And certainly, our clients are asking about this, about a concern of a recession and that there were a lot of headlines maybe a couple of months ago. Headlines that were saying that the U.S. recession was potentially on the horizon, maybe only 12 or 18 months away. But there was definitely stronger signs a few months back. What do you think has caused some of that to lessen, in your perspective?
Ryan Kelley, CFA®: I would say continuing economic data looks positive. As I mentioned, Jerome Powell came out and said that there was some noise about a yield curve inversion, which has since gone away. We’re no longer inverted on the yield curve, and a lot of investors look at that as a potential sign of recession. Since were no longer inverted, a lot of people have then said well, okay, then maybe the economy will continue to keep growing, without a recession hitting. So, it has really pushed back a lot of the financial prognosticators’ timing about a potential recession. I know I kept hearing oh, 2019 there will be a recession – and now they always seem to be about 12 months out. And [the prognosticators] just keep extending and extending. So, I think things are a little bit more upbeat. The only thing I would caution though is that, historically, recessions are very hard to predict. They can happen even when things otherwise look rosy, and data can turn around pretty fast. So, while we don’t see one on the horizon, we know they are inevitable and certainly something that you should be accounting for in your plan. At least mentally fortifying yourself for. That it will occur at some point and there will be volatility. And that’s just part of investing. Let me turn things over to Laurent – you can discuss some of the election, and how it’s historically driven financial markets.
Laurent Harrison, CFP®: Sure, great, thank you. So, to start with, I thought that we would make just a few points – historical review. The first one is just in general, it’s not specific to election years. But year-end rallies, known as “Santa Claus Rallies” are common most years. Since 1950 in fact, the S&P 500 Index has gained an average of 1.3% in the seven-day stretch between the last five trading days of the year and the first two days of the new year. So, something to hopefully be positive about as we head into the holiday season. Another point of thought that’s interesting, was that if you do examine the return of the S&P 500 Index, in the past 23 election years since 1928, you’ll see that in only four of those years was the market negative. So, again, another set of really good statistics and percentages leading up to hopefully having a positive year next year. Furthermore, just a couple of things about looking back at if Democrats win the White House, stocks are typically down slightly. I think it was less than a percent if I remember the stat. If Republicans win the White House, and again they’re considered a little bit more business-friendly, stocks were typically up slightly after that. However, I do want to make a point that really market concerns typically dominate the market ups or downs really over election year politics. So, that’s kind of three interesting points and kind of taking a look at historical review of election years.
[In] the next slide (Figure 6), actually we presented this in November of 2016 when we were doing our webinar at that point. So, I kind of plucked this slide from that webinar. And what was interesting, leading up to the 2016 election, is there were plenty of forecasters and experts – expert opinions abounded if you will about the last election. And many actually predicted that if Trump won the White House, there would be a five to ten percent correction. And that correction would last several months or more. And what this slide is showing you is really during the night essentially, evening of the election, there was a 5% pullback. But it really lasted only about 10 hours. And by the following afternoon, the day after the election, the market really had already recovered all of its downward momentum. So, again, those prognosticators and forecasters invariably are usually wrong. However, we are getting quite a few clients asking about election 2020, and more about the historical perspective and what might happen. So, I thought we would present a few important data points about what happens in election years and post-election years in terms of the market.
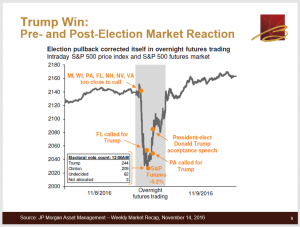
Figure 6 – Trump Win: Pre- and Post-Election Market Reaction
So, typically, first two years of a presidential term is where essentially the markets don’t do nearly as well. In fact, the first year of a President’s term usually we see about a 2.5% return and that’s in the Dow Jones Industrial Average. The second year about 4.2% return. But in the third and fourth years of a presidential term, those are usually pretty solid. So, if you take a look back since 1833 we’ll see that the average gain in the Dow Jones Industrial Average in their third year of a presidential term was about 10.4% – in fact that was the best. And really the last year of a presidential term was essentially 6%. So, the third year is this year and obviously we’re having a bang-up year as Ryan showed earlier. And so that does potentially mean next year might be a positive year, maybe not as good as this year, but hopefully maybe in the high single digits. So, again, bold markets and strong economic returns definitely tend to be the case in the latter half of a presidential term. Part of that is due to the current party in the White House really wants the economy to perform well. And generally, those are positive aspects that the current President can turn to if they’re stumping for a second term. So, that’s just a little bit of historical perspective. And now I’m going to turn it back over to Ryan to talk a little bit about taxes.
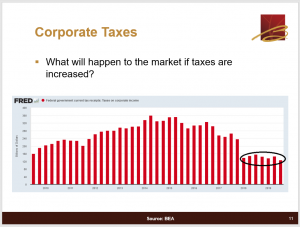
Ryan Kelley, CFA®: Thanks, Laurent. So, one of the questions that clients have asked our advisors here is, what will happen to the stock market if taxes are increased. There was the Tax Cuts and Jobs Act, which I’ll just call the “Trump tax cuts,” that went into place shortly after his election. And they did cut corporate taxes, which you can see I’ve circled here (Figure 7). You can see the effect of this tax law change. And so, what would happen if this law was reversed by potentially a future Democratic President. So, it’s clear that yes, if all else equal, the tax cuts were repealed and we went back to our old tax code, (that all was equal, again) stock prices would go down. Because obviously profits would shrink, as the government was taking a larger bite out of corporate profits [before the Trump tax cuts]. What I would say is that the top marginal tax rate on the corporate side of things, in the U.S., was 35% previously. It’s now 21%. Well, 21% is actually right in line with the developed country average. So, we actually had a very uncompetitive tax rate prior to this tax cut. So, I think there would be a lot of pressure, if they were trying to reverse it, to go back to a very uncompetitive rate. I would also point out that actual taxes paid, they really depend on a lot of factors. So, a lot of it is actually country policies rather than just the rates. You know, depreciation. Can you capitalize or expense certain things? On what time frame? And a lot of these things effect certain sectors more than other sectors. As well as, how much of your income is being sourced from foreign sources verses domestic? How much your business is more intellectual property? So, there’s a lot of factors that go into it. It’s not just so simple to say, oh look the top rate increases or decreases.
And I’d also point out the main thing is that we’re still very gridlocked in our government. It’s very hard to get anything passed. So, even if there was a Democratic President it would be very difficult for them to reverse anything. And I’ll just look back at two historic things that happened, as well to give you some interesting data. So, the first I’ll discuss is the Affordable Care Act – often called, “Obamacare.” So, when President Obama was elected, it was kind of unusual because there’s about two years where there was both a Democratic House, Democratic Senate, as well as Democratic Presidency. And that’s how they were able to push through the Affordable Care Act. They did actually have a super majority, if my memory serves right, in the Senate so they could avoid filibuster threats. Even then, there was talk about trying to push through a so-called “public option” in the Affordable Care Act. And the Democrats still weren’t able to get that passed. There was still enough resistance from within their own party. But that just wasn’t a viable feature to add into the law. With the “Trump tax cuts” I mentioned earlier, those actually only were able to get passed in the Senate because, again, this was a Republican President, House, and Senate. Although I can’t remember the exact number, but it was in the 50s, so not a filibuster-proof amount of Republicans in the Senate. But the only way they were able to pass this tax cut law was by using some maneuvers or something called a “Budget Reconciliation maneuver,” which allows them to pass laws without a filibuster threat. But the only way they’re able to do it was to include some sunset provisions that would allow this maneuver to be used. And by the way, those sunset provisions are on the individual tax side of things, not on the corporate tax side of things. So, there is no sunset on the corporate tax rates that got reduced. But I also use these as two examples to say it’s going to be very hard for a potential future Democratic President to make any significant adjustments in tax code, and really anything else that isn’t bipartisan. I’ll give you some interesting data. There’s something called “prediction markets.” And I would give an analogy that these “prediction markets” are sort of like looking at the odds in Las Vegas. If you’re trying to look at a sporting event and you can see where the Patriots are favored to win over say, the New York Giants (or something like that). It’s a way for people to place bets. And the amount of bets on one outcome or the other sort of adjust the odds, and you can use that as a probability signal.
So, I was looking at them the other day and there was a 74% predicted chance of a Democratic House in the next election. But still a 67% chance of Republican control in the Senate. So, I think that’s where the roadblock will come in on really any kind of significant law changes – even with a Democratic presidency. And speaking to that, there was a 55% chance of a Democrat winning the White House (over Trump) in the next election. So, fairly close on that front. Some other interesting facts just since we’re discussing this. There was a predicted 12% chance that the Senate will convict Trump, if he’s impeached in his first term. And a bit, this one surprised me, but there’s a predicted 71% chance that Rudy Giuliani will be criminally charged with something by the end of 2020. Which I think 1) is a bit funny, but 2) shows just how esoteric some of these bets can be, that you can place on these prediction markets. So, with that let me turn things back to Laurent to discuss some year-end tax items.
Laurent Harrison, CFP®: Great, so shifting gears back to end-of-year savings, money, and tax tips. The next few slides are going to cover those and there are some for those that are retired and retirees. And there are also some for those that are still working that are looking for ways to maybe lower their tax bill before the end of the year. So, the first of those are on Required Minimum Distributions. So, again, most of our clients that have RMDs have either had them completed, or will have them completed by the end of the year. But if for some reason you have an IRA account that’s not under Bell Management and you are 70 and a half or older, you should definitely know that you have to take those distributions before year end. The only notable exception is if it’s your first year RMD, meaning you just turned 70 and a half this year, you do have an option of pushing that off to the following year. But Bell helps all of our clients with their RMDs, so even if you have an IRA that we’re not managing, feel free to give us a call and we can give you some help on those.
For those that are subject to an RMD, you are probably aware that any distributions from any of your [traditional] IRAs are taxable income. And so, really, the only way to avoid taking that as a taxable distribution is through something called the Qualified Charitable Distribution rule or QCD. And the way that works is that, if you are planning for charitable contributions this year, and there’s still time left between now and the end of the year. You can take some or all of your RMD (up to a $100,000) and you can actually use that money and pay a charity directly and you actually avoid paying taxes on that distribution. One of the caveats is that you have to make the distribution directly from your IRA. So, that means essentially making sure that the name of that charity is on that check. And that it’s not payable to you, and then you turn around and pay that charity. So, just a couple of things on RMDs and the QCD rule.
For those that are potentially not subject to RMDs, but are looking for ways to kind of save on their taxes, I have done this personally and I think it’s a great way [to save on taxes]. So, if you’re still able to itemize contributions on your tax return, after the change in the tax cuts law – where they really increased the standard deduction quite a bit – this is a great way to still be able to itemize. So, again, if you’re [ not subject to RMDs and you’re] not itemizing or you don’t think you’ll be able to, we love the fact that you’re going to do charitable contributions. But it’s not going to really help you on your tax return. But the idea behind this is that if you’re normally going to, do let’s say, a small contribution in one year and you do that every single year, you can actually bunch up maybe two, three, four years’ worth of those charitable contributions, and do it all this year in a single year. And the benefit is that you maximize that particular deduction in this one year. And then what happens is that money sits in that investment account (that donor-advised fund account) and it can be sitting there as long as you want, and then you can make contributions from that in future years. But again, you do get a much bigger, hopefully itemizable, contribution to that charity in a single year. So, that’s the Donor-Advised Fund option.
However, if you don’t want to do that, it’s still possible to donate taxable, appreciated shares to a charity. So, this would be from one of your brokerage accounts. Let’s say you have an ETF or a mutual fund. You’ve got a 30% gain on that because again, as Ryan said earlier, this year has been a pretty phenomenal year. You can actually escape capital gains, and associated taxes on those shares, if you donate those shares directly to charity. There are a couple of rules though. If there is a gain, you actually had to have held those shares for at least one year and one day in order to actually get the benefit. Just a little bit of a caveat, if you donate shares that have a loss, it really works against you. So, you really don’t want to donate shares that have had a loss, from a tax perspective, to that charity.
And then lastly, just a couple of items. I’m going to cover the first and Ryan is going to cover the second. You can certainly always do cash gifts to individuals. A lot of times parents do that to their children or to relatives. Just be aware that this year it’s still a $15,000 limit [in order to not have to] file a gift tax return. So, that would be per person, per recipient. We do like our clients who are considering gifting, to maybe a 529 plan for a child or grandchild, to just be aware that again those gifts have to be completed by 12/31/2019. And of course, if you’ve got maybe a favorite stock you bought maybe 20 or 30 years ago, those appreciated shares can also be gifted to individuals. And I’ll pass this back over to Ryan for comment on mutual fund distributions.
Ryan Kelley, CFA®: Sure. So, at the end of the year, mutual funds are required to issue distributions if they have taxable gains. So, this would be within the mutual fund itself, if [the mutual fund] bought and sold a security at an appreciated price. So, therefore there’s a gain on it and legally they have to distribute these capital gains to you, as an underlying shareholder. I’m pointing this out because, what you’ll see is that for example, if there was a fund and you held one share of the fund, and the fund was worth $10. They issued in an extreme case, a 50% distribution – that would be very high. Typically, it’s under 10% or so. But in this case you would then own two shares but the price would drop to $5. And I just point this out because there is this kind of delay, you may see in your account, where it looks like your investment in this case fell 50%. In reality the price fell, but the amount that you own may have doubled, assuming you reinvested or you would just take it in cash. So, it’s not really a loss, it’s just a legal mechanism that they’re required to do to issue distributions. So, I just wanted to point this out to clients so they don’t get upset if they do see this. Just keep in mind that it’s pretty common in December to see this behavior and it’s just a temporary thing.
Laurent Harrison, CFP®: Yeah, that’s a great point Ryan because we’ve gotten clients before that emailed us, that see up to a 10% drop in their shares and they really think that something has happened to those shares. And why didn’t we maybe warn them that was going to happen. So, that’s certainly appreciated. All right, so really that concludes everything that we wanted to share with you today. And so, in terms of what we covered, Ryan covered a bit on the U.S. economy, updates on whether we think there is a U.S. recession near-term, which we don’t. I covered a little bit more on election 2020 and maybe what happens during different years of a presidential election. And Ryan and I both covered kind of end-of-year tax savings and giving tips. We do encourage you, if something came up during the webinar, or if you think of a question later, please go ahead and email your relationship manager or your lead advisor who would be happy to answer your questions. We would like you to stay in touch, so visit our website, sign up for our e-newsletter, email us, call us, we’re certainly very responsive. And we hope that this was very helpful for you. Again, thank you so much.